







Driftwise homeDriftwise home
Driftwise · Environmental Monitoring Platform

Turn field observations into agency-grade monitoring evidence.

Driftwise is the system of record that agencies and conservation organizations run their fisheries, habitat, and waterway monitoring programs on. Crews capture data in the field, and Driftwise turns it into the evidence your agency and funders expect.

Pick Your Vertical

Built on authoritative public data

Driftwise scores environmental risk from live and modeled readings across more than a dozen federal monitoring sources.

THREE VERTICALS / ONE PLATFORM

Select the vertical you run.

Choose one below and the rest of the page — the example flow, mobile companion, and intelligence panels — rewrites itself to match.

Fisheries & Aquatic

Run a mark-recapture program without the binder.

Driftwise keeps catch photos, sampling CSVs, and recapture matches organized by watershed and reach. The population record stays defensible because every match is logged and reviewed.

01 / 03

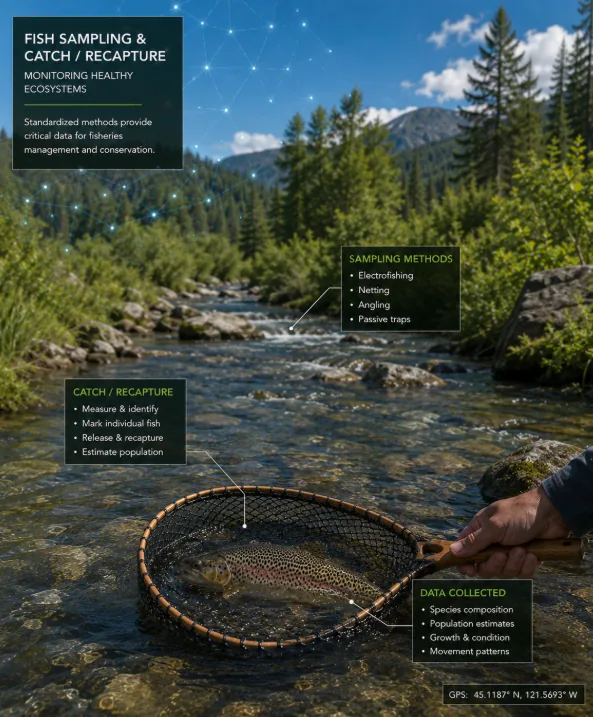
Catch & Event Capture

Anglers and biologists submit photos, lengths, and locations from the field. Electrofishing and seining events upload as CSV batches.

  • Photo, GPS, species, and length in one submission
  • Bulk CSV ingest for sampling events
  • Works offline; syncs when signal returns
02 / 03

Individual Identity Matching

PIT tag and mark-recapture matching links each capture to a known individual. A reviewer confirms the match before it enters the population record, so nothing gets counted twice.

  • PIT tag matching
  • Human QA review queue
  • Provenance recorded on every match
03 / 03

Population Intelligence

Recapture intervals, growth curves, and reach-level abundance estimates come out as the figures that go straight into agency and grant reports.

  • Growth and survival curves
  • Reach-level abundance dashboards
  • Export-ready report figures
  • Grant summary tables
Habitat Restoration & Invasives

Get every partner working off the same map.

Multi-stakeholder restoration falls apart when each crew keeps its own spreadsheet. Driftwise holds every infestation, treatment, and re-survey in one place, with the privacy and partner controls that shared work requires.

01 / 03

Geolocated Sightings

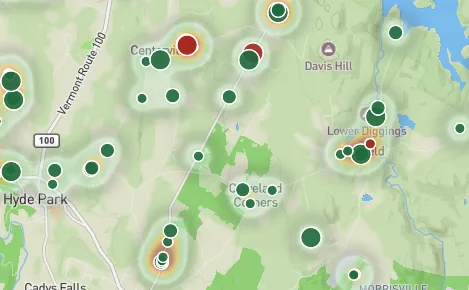
Field crews and volunteers drop sightings with species, density, and photos. Hotspots emerge as clusters and heatmaps when the map zooms out.

  • Photo, GPS, species, and density per sighting
  • Cluster and heatmap views
02 / 03

Treatment Status Tracking

Every sighting carries a status: untreated, treated, or re-survey due. A treatment log per visit keeps the chain of custody intact across crews and seasons.

  • Untreated, treated, and re-survey-due states
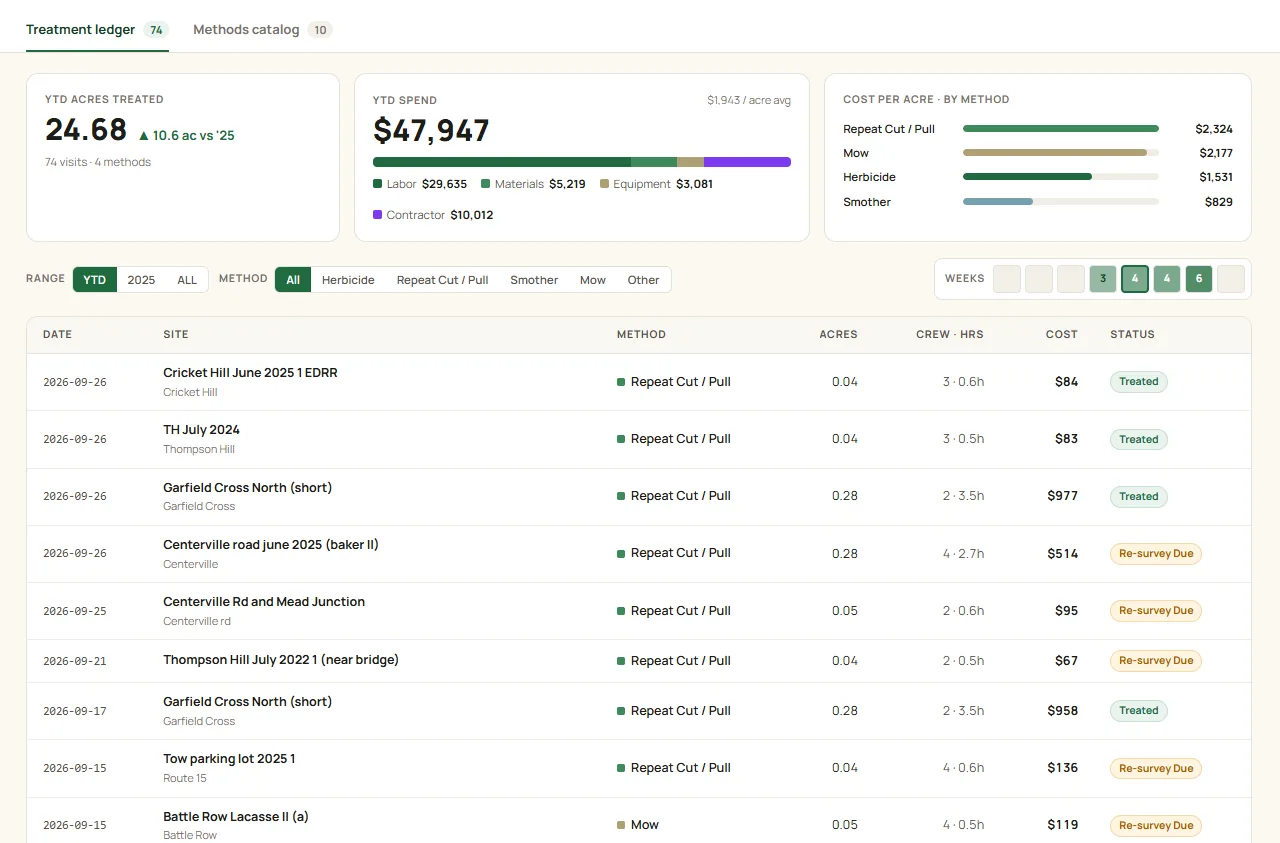
  • Treatment log per visit with method and crew
  • Re-survey scheduling with reminders
03 / 03

Spread & Priority Intelligence

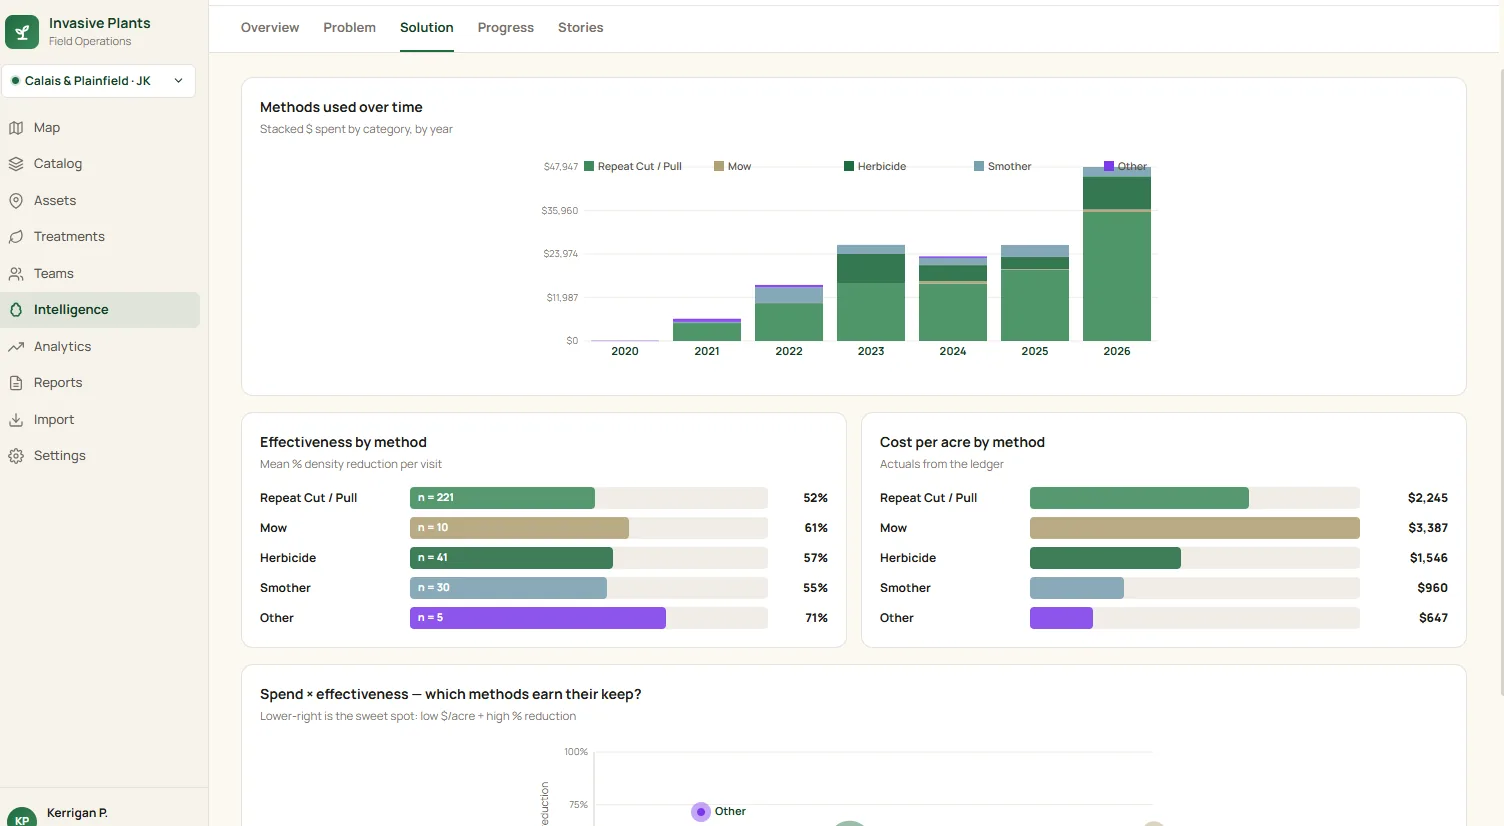
See where infestations are expanding year over year, which sites sit on top of sensitive habitat, and which treatment methods are actually holding. Shareable with partners.

  • Year-over-year spread analysis
  • Priority scoring against sensitive habitat
  • Treatment effectiveness by method
  • Partner-shareable exports
Waterway Management

Publish conditions the public can trust.

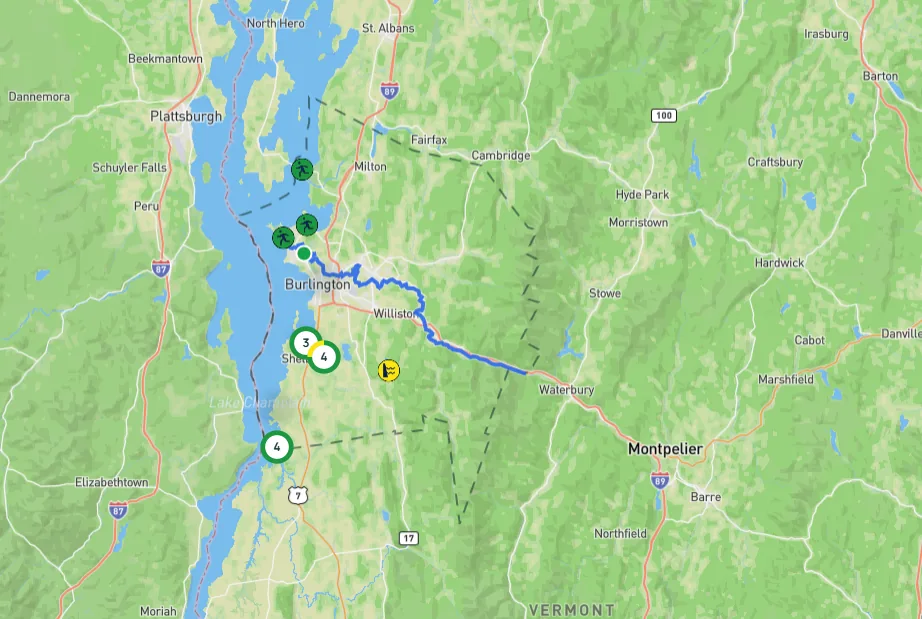
When a tree comes down or the river spikes, paddlers find out from your map before they put in. A structured corridor model and a fast review workflow keep what is published accurate.

01 / 03

Corridor & Asset Management

Define the trail with segments, access points, portages, and amenities. Every attribute change is versioned, so you can see who changed what and when.

  • Snap-to-river segment drawing
  • Access points, portages, and amenities
  • Versioned attribution with full history
02 / 03

Status Workflow Engine

Publish closures, advisories, hazards, and condition reports with a verification level and urgency attached. Conflict detection catches contradictory updates before they reach the public map.

  • Verification level and urgency on every update
  • Conflict detection across overlapping reports
  • Audit log per status change
03 / 03

Public Map + Usage Insights

A branded public map, an embeddable widget for your site, and shareable URLs. Visitor analytics and seasonal patterns tell you where to focus next season's programming.

  • Branded public map and shareable links
  • Embeddable widget for your site
  • Visitor analytics and seasonal usage patterns
Example Flow · Fisheries

From Catch Photo to Recapture Evidence

Here is what a mark-recapture season looks like in Driftwise: crews log captures on the water, the data organizes itself by reach, and the monitoring report writes itself from there.

01
STEP 01 / 04

Capture in the Field

Driftwise offers fully supported in-field data collection — capture catches on-site or import them on the web, whichever fits your workflow. Offline field entries queue and sync the moment a connection returns.

Driftwise screenshot: Capture in the Field — Fisheries
02
STEP 02 / 04

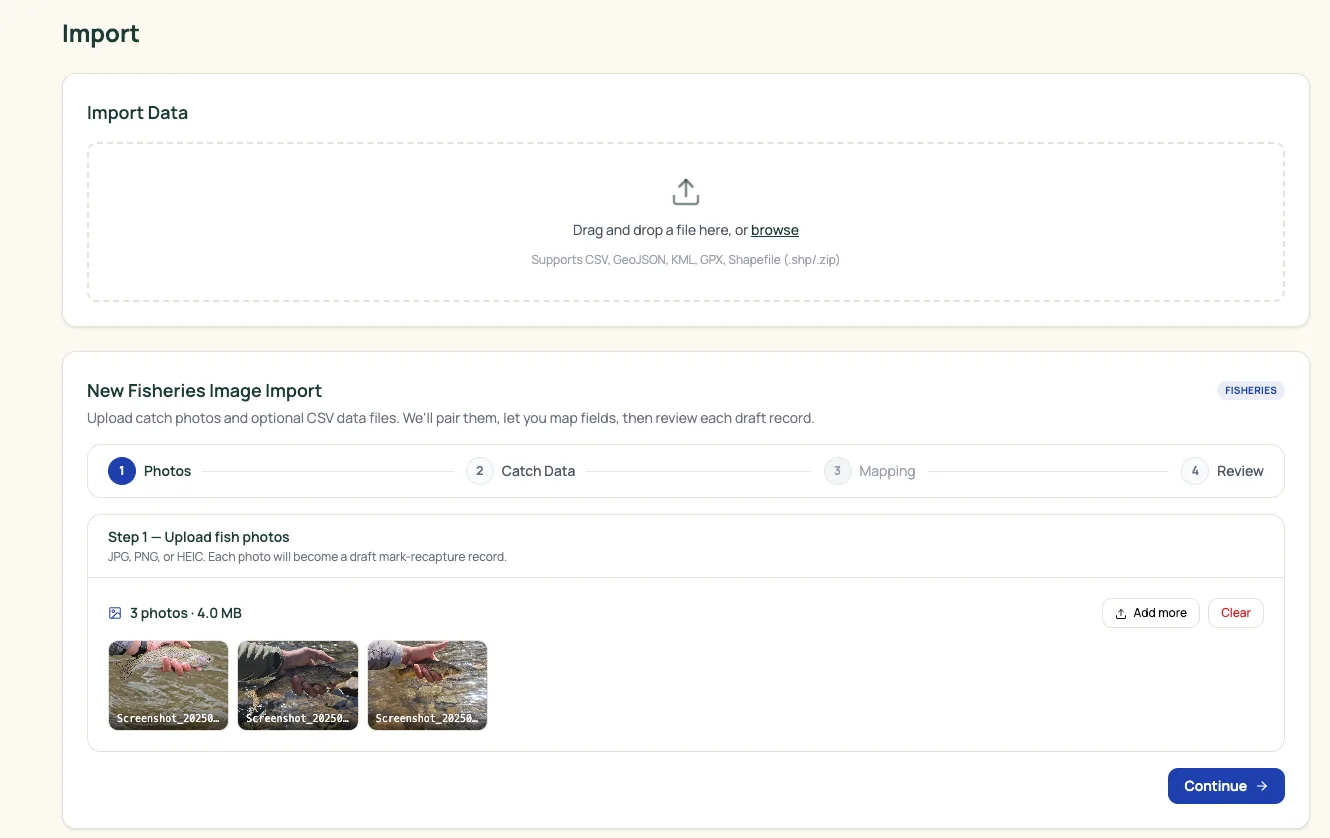
Upload Photos & CSVs

Drag in a CSV of sampling events. Photos batch by event and watershed on their own. Everything files itself under the right project, reach, and reporting period.

Driftwise screenshot: Upload Photos & CSVs — Fisheries
03
STEP 03 / 04

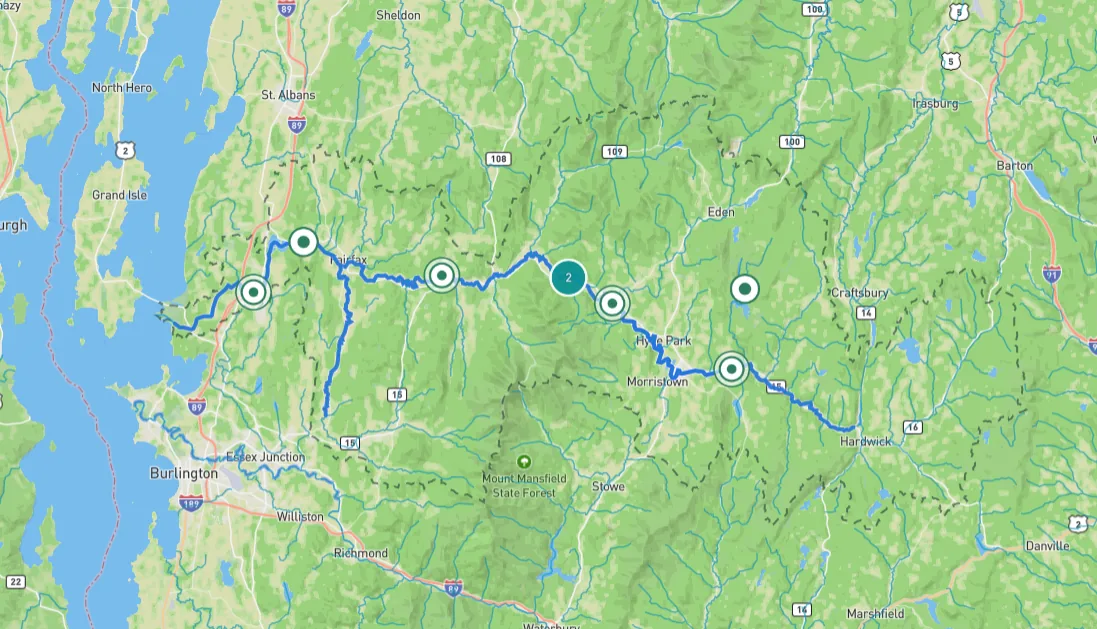
View Map & Identity Matches

Every observation lands on a watershed map. PIT tag and mark-recapture matching proposes links to known individuals, and a QA reviewer confirms each one before it enters the population record.

Driftwise screenshot: View Map & Identity Matches — Fisheries
04
STEP 04 / 04

Gain Insights

Recapture intervals, growth curves, and reach-level abundance estimates roll into dashboards your agency partners recognize. Export the exact figures that go into the monitoring report.

Driftwise screenshot: Gain Insights — Fisheries
Example Flow · Habitat Restoration & Invasives

From Flagged Sighting to Coordinated Response

One shared map holds every infestation and the treatment history behind it. Partner crews see the same picture, so the same patch does not get sprayed twice or missed entirely.

01
STEP 01 / 04

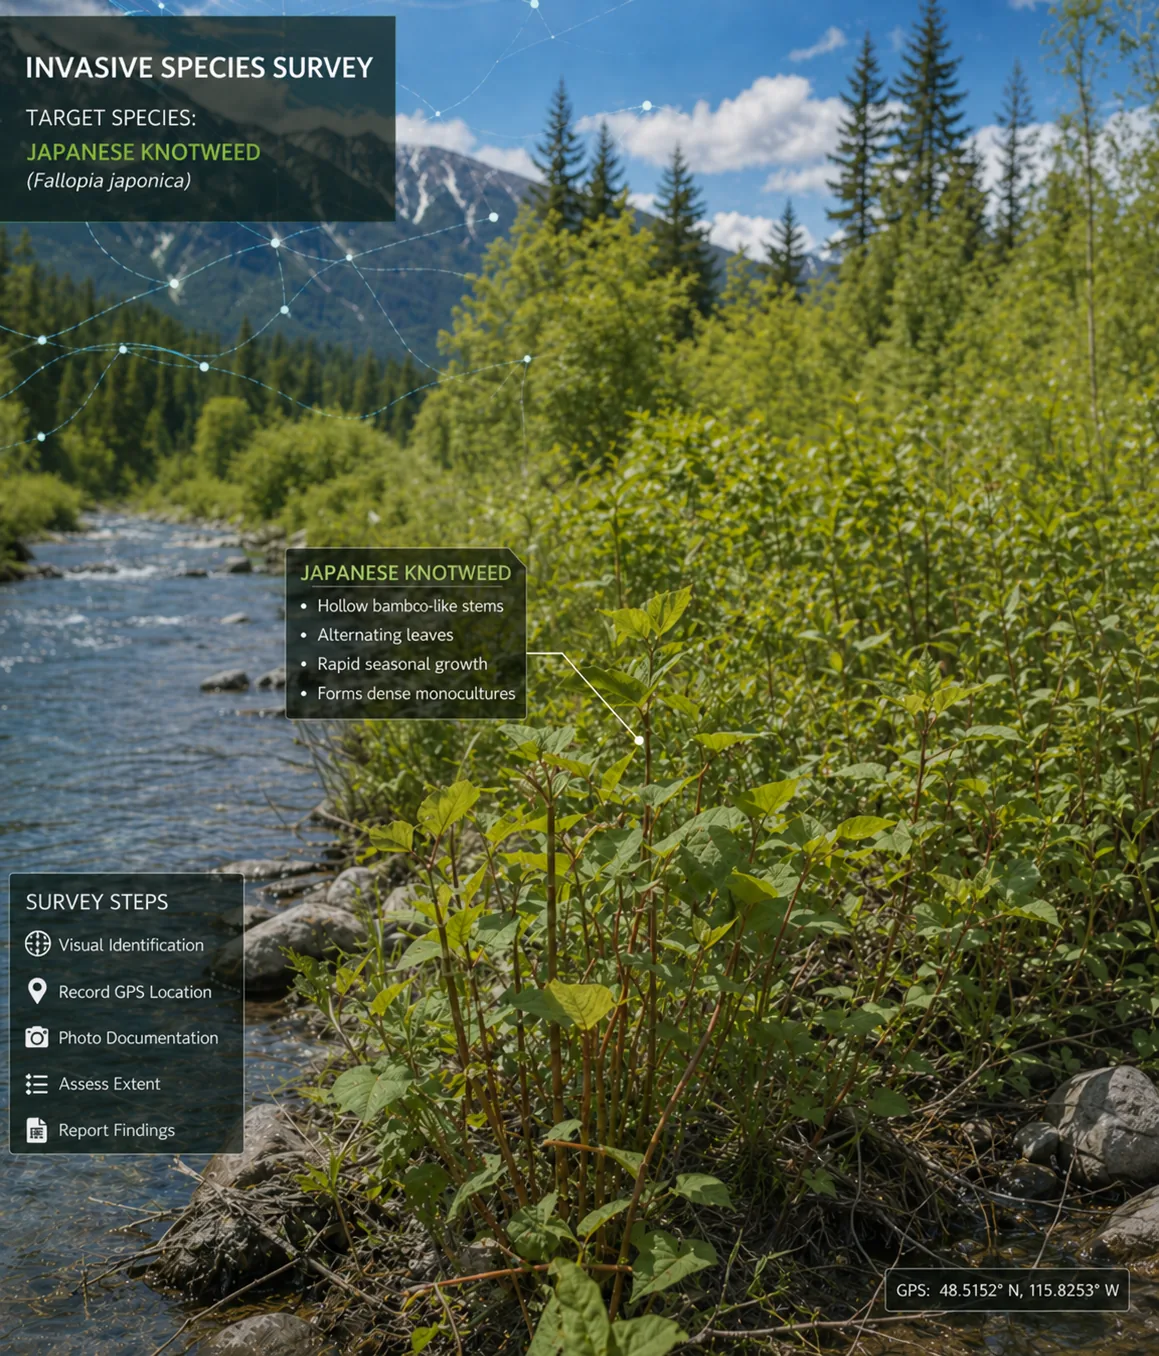
Flag a Sighting

Field crews drop a sighting with species, density, and a photo, even with no signal. Sensitive-habitat overlays show on the map while you log, so crews know what they are standing next to.

Driftwise screenshot: Flag a Sighting — Habitat Restoration & Invasives
02
STEP 02 / 04

Map Sightings & Hotspots

Every sighting drops as a point on a shared map. Clusters and heatmaps surface hotspots as you zoom out. Drill into any single sighting and the photo, GPS, and timestamp are still attached.

Driftwise screenshot: Map Sightings & Hotspots — Habitat Restoration & Invasives
03
STEP 03 / 04

Track Treatment Status

Each sighting carries a status: untreated, treated, or re-survey due. A treatment log captures method, crew, and conditions on every visit, so partners can coordinate timing without stepping on each other.

Driftwise screenshot: Track Treatment Status — Habitat Restoration & Invasives
04
STEP 04 / 04

Gain Insights

See year-over-year spread, which sites score highest against sensitive habitat, and which methods are holding the line. Export partner-shareable maps and the reports your funders ask for.

Driftwise screenshot: Gain Insights — Habitat Restoration & Invasives
Example Flow · Waterway Management

From Corridor Setup to Public Map

Plot the trail once. After that, a field report turns into a public advisory in minutes, and the way visitors use the map tells you what to fix before next season.

01
STEP 01 / 04

Build a Project Collection

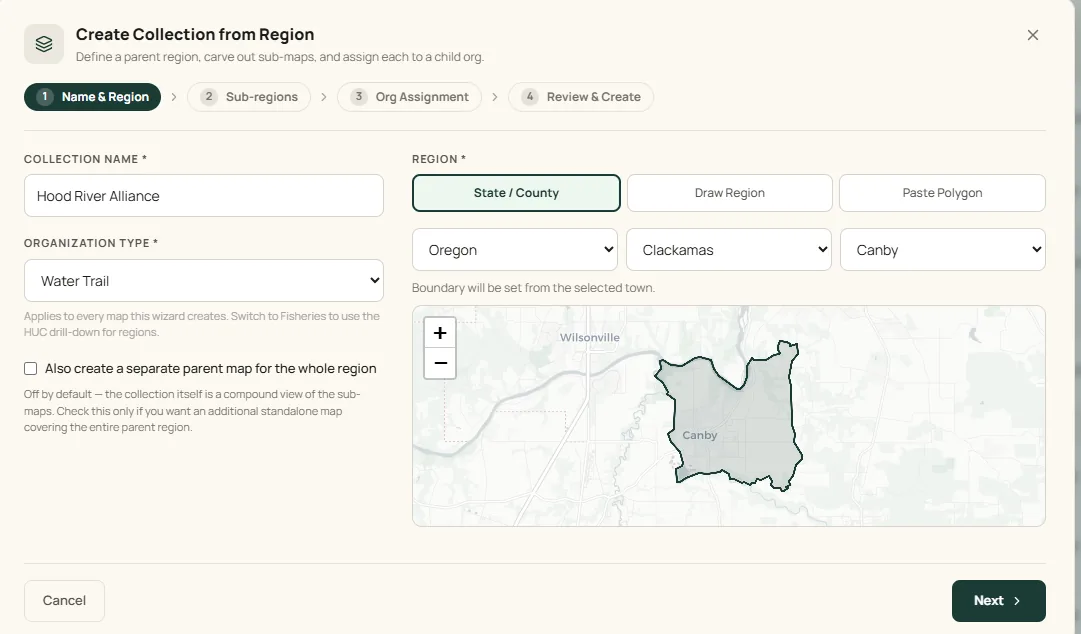
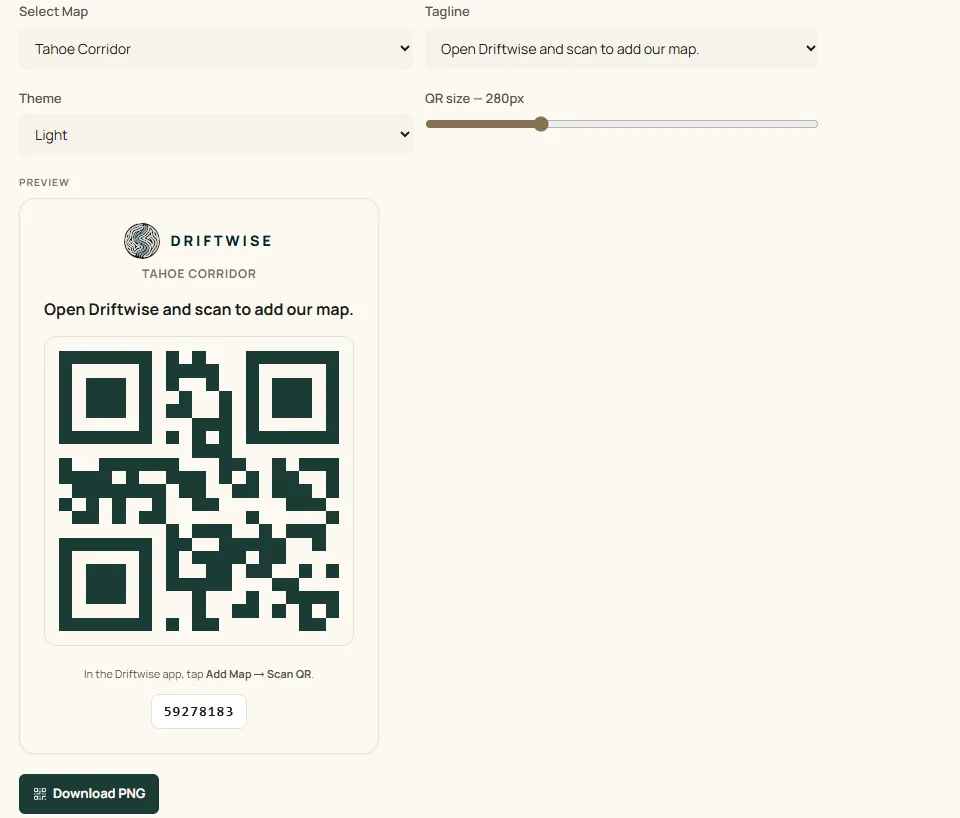
Group projects by state, county, or town — or by watershed resolution — into one collection, with each sub-map assigned to its own child organization. An optional parent map rolls every sub-project into a single regional view.

Driftwise screenshot: Build a Project Collection — Waterway Management
02
STEP 02 / 04

Plot your Data

Draw segments, access points, portages, and amenities, or import what you already have from CSV, GeoJSON, or KML. Attribution is versioned from the first edit.

Driftwise screenshot: Plot your Data — Waterway Management
03
STEP 03 / 04

Field Check & Status Update

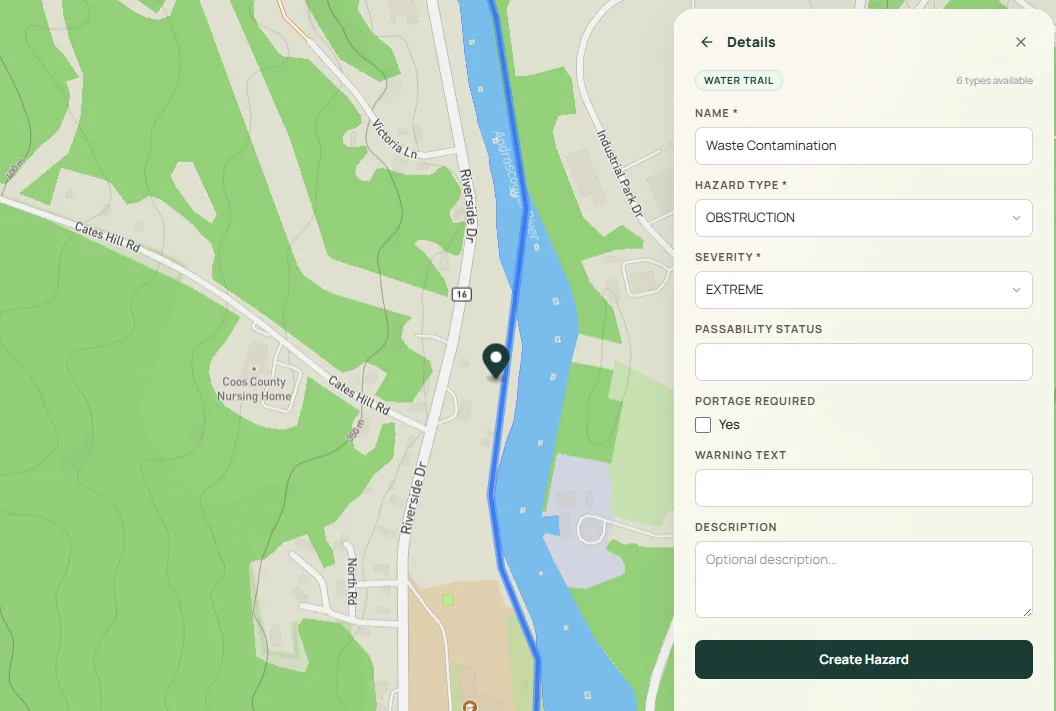
A volunteer logs a downed tree from the river. The update carries a verification level, an urgency, and the photo. Conflict detection flags overlapping advisories before anything goes live.

Driftwise screenshot: Field Check & Status Update — Waterway Management
04
STEP 04 / 04

Publish to the Public

Your branded public map updates the instant staff approves. Color-coded status, shareable links, and an embeddable widget for your site mean paddlers see the current picture, not last week's.

Driftwise screenshot: Publish to the Public — Waterway Management
Mobile Companion · Habitat Restoration & Invasives

The field tool that keeps the map honest.

Crews flag infestations and log treatments from the site itself, with sensitive-habitat overlays visible while they work.

  • Photo, GPS, species, and density, offline-capable
  • Sensitive-habitat awareness on the map
  • Treatment log per visit: method, crew, conditions
  • Re-survey scheduling with reminders
Mobile Companion · Waterway Management

A downed tree becomes a public advisory in minutes.

Volunteers and rangers report a hazard from the put-in. Staff approve it, and it is on the public map before the next paddler arrives.

  • Quick hazard report with photo and location
  • Verification level and urgency captured in the form
  • Offline capture for remote put-ins
  • Submit-to-publish review queue for staff approval
Population Intelligence

Population dynamics you can defend.

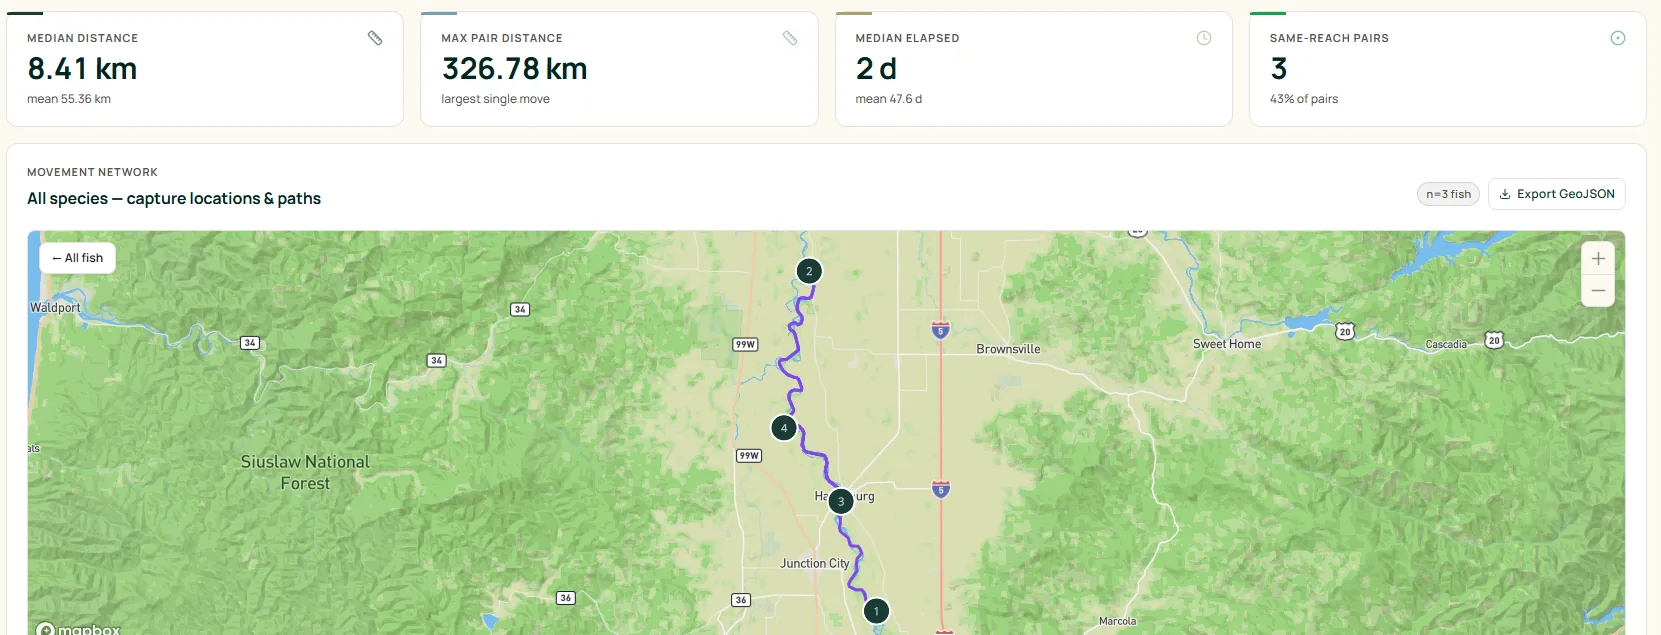
Identity-matched recaptures trace how fish move and grow across the river network, while a live read on study coverage and data completeness shows how much of the picture is filled in — and where the gaps are. These are the figures and methods agency reports cite.

PANEL / 01Capture-network analytics

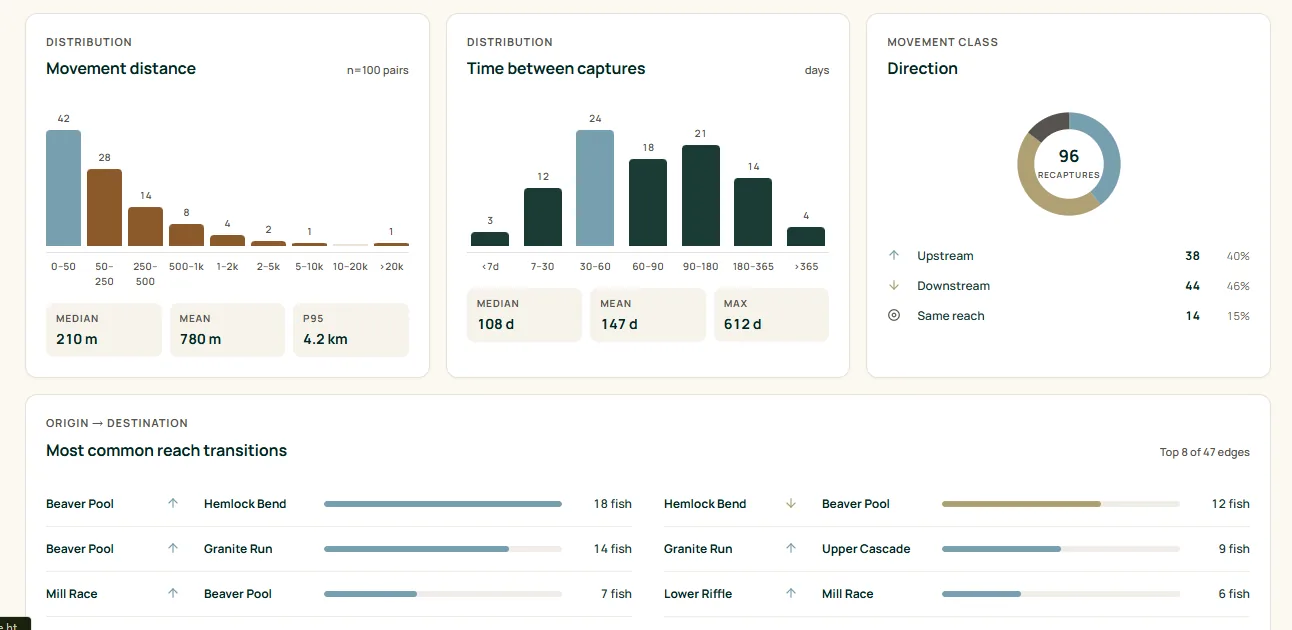
Movement & Dispersal

Driftwise Population Intelligence panel: Movement & Dispersal — Capture-network analytics
  • Recapture paths trace each fish up and down the river
  • Distance and elapsed-time deltas separate site fidelity from dispersal
  • Movement networks export as GeoJSON for partners and habitat modelers
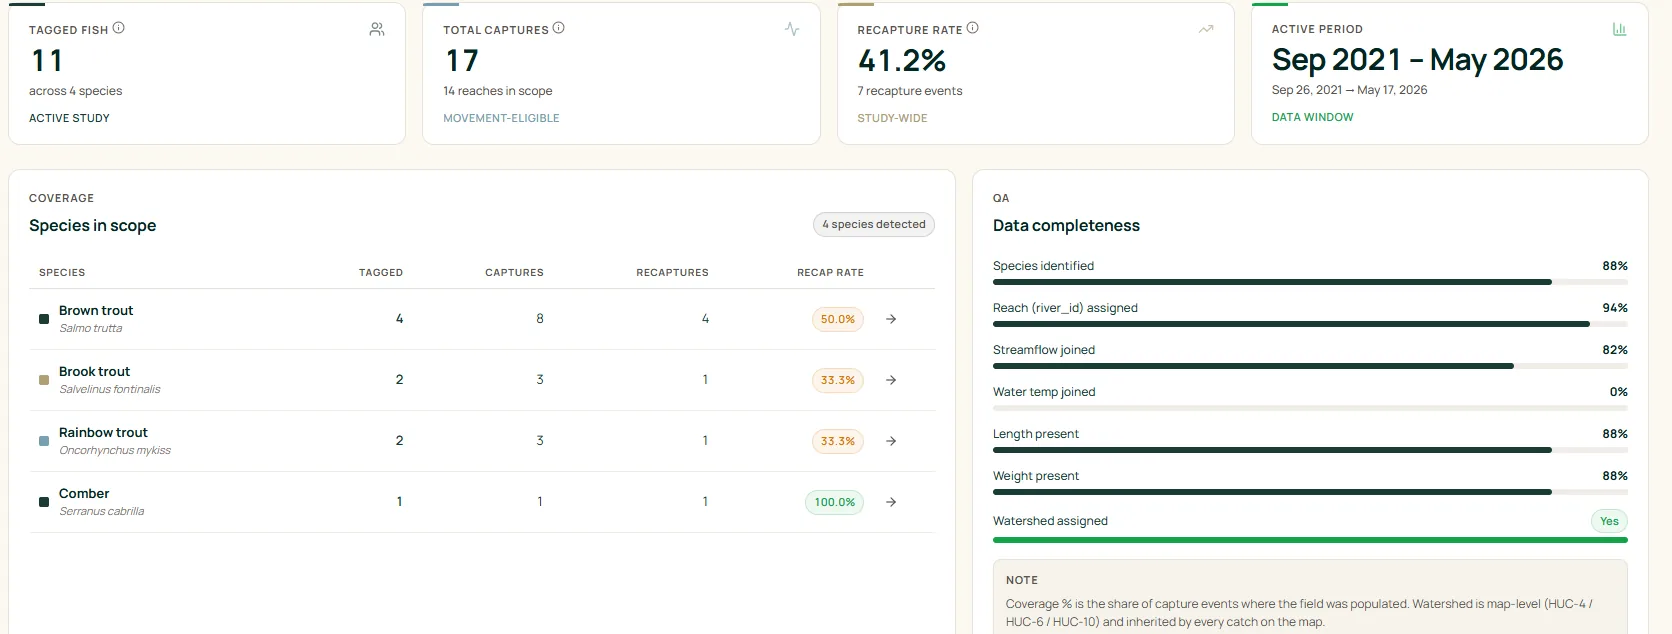
PANEL / 02Coverage + QA at a glance

Study Coverage & Data Quality

Driftwise Population Intelligence panel: Study Coverage & Data Quality — Coverage + QA at a glance
  • Whole-study headline stats — tagged fish, total captures, recapture rate, and active period — rolled up across every species and reach in scope
  • Per-species breakdown of tags, captures, recaptures, and recapture rate, so you can see which populations are carrying the signal

Every number on this page is traceable back to the field record it came from.

Walk through a mark-recapture report
Spread & Priority Intelligence

Where the threat is moving, and where to act first.

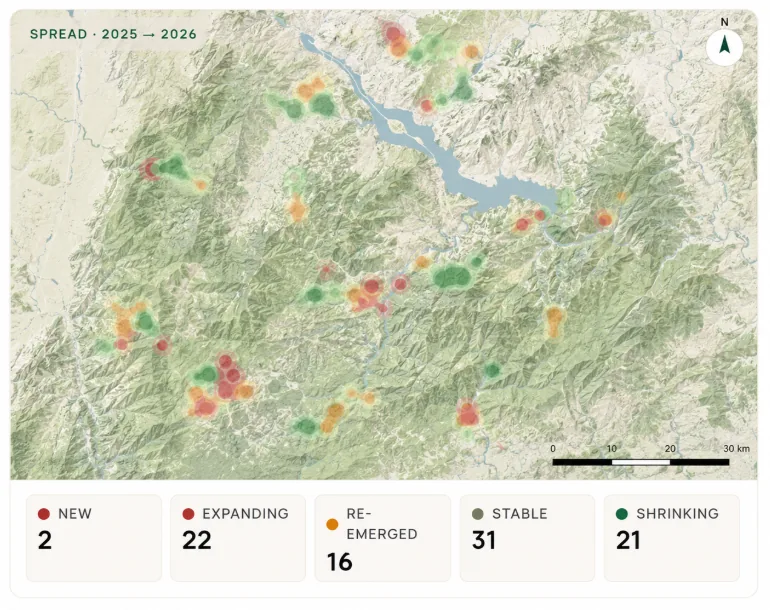
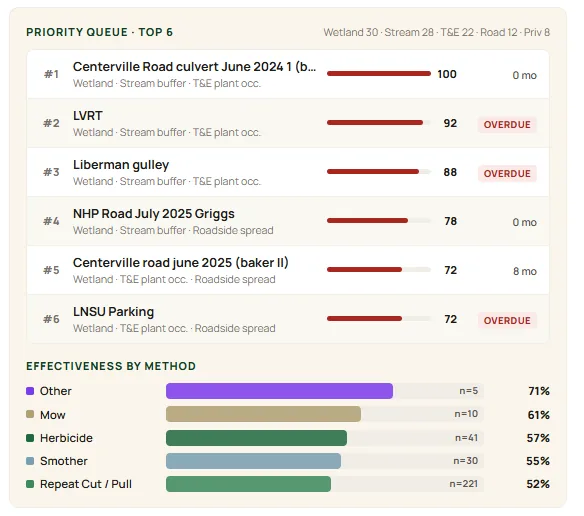
Spread analysis shows how infestations changed between survey periods. Priority scoring ranks sites by their overlap with sensitive habitat, so a short field season goes to the patches that matter most.

PANEL / 01Year-over-year hotspot delta

Spread Modeling

Driftwise Spread & Priority Intelligence panel: Spread Modeling — Year-over-year hotspot delta
  • Density change per hotspot between survey periods
  • Flags for new, expanding, and re-emerged infestations
  • Spread vectors projected from your field data
PANEL / 02Sensitive-habitat scoring

Priority & Effectiveness

Driftwise Spread & Priority Intelligence panel: Priority & Effectiveness — Sensitive-habitat scoring
  • Habitat-overlap priority score per hotspot
  • Treatment effectiveness broken out by method, season, and crew
  • Re-survey scheduling that follows the priority score

Every number on this page is traceable back to the field record it came from.

See how priority scoring builds a season plan
Environmental Risk · Intelligence

A risk score for every reach — and the evidence behind it.

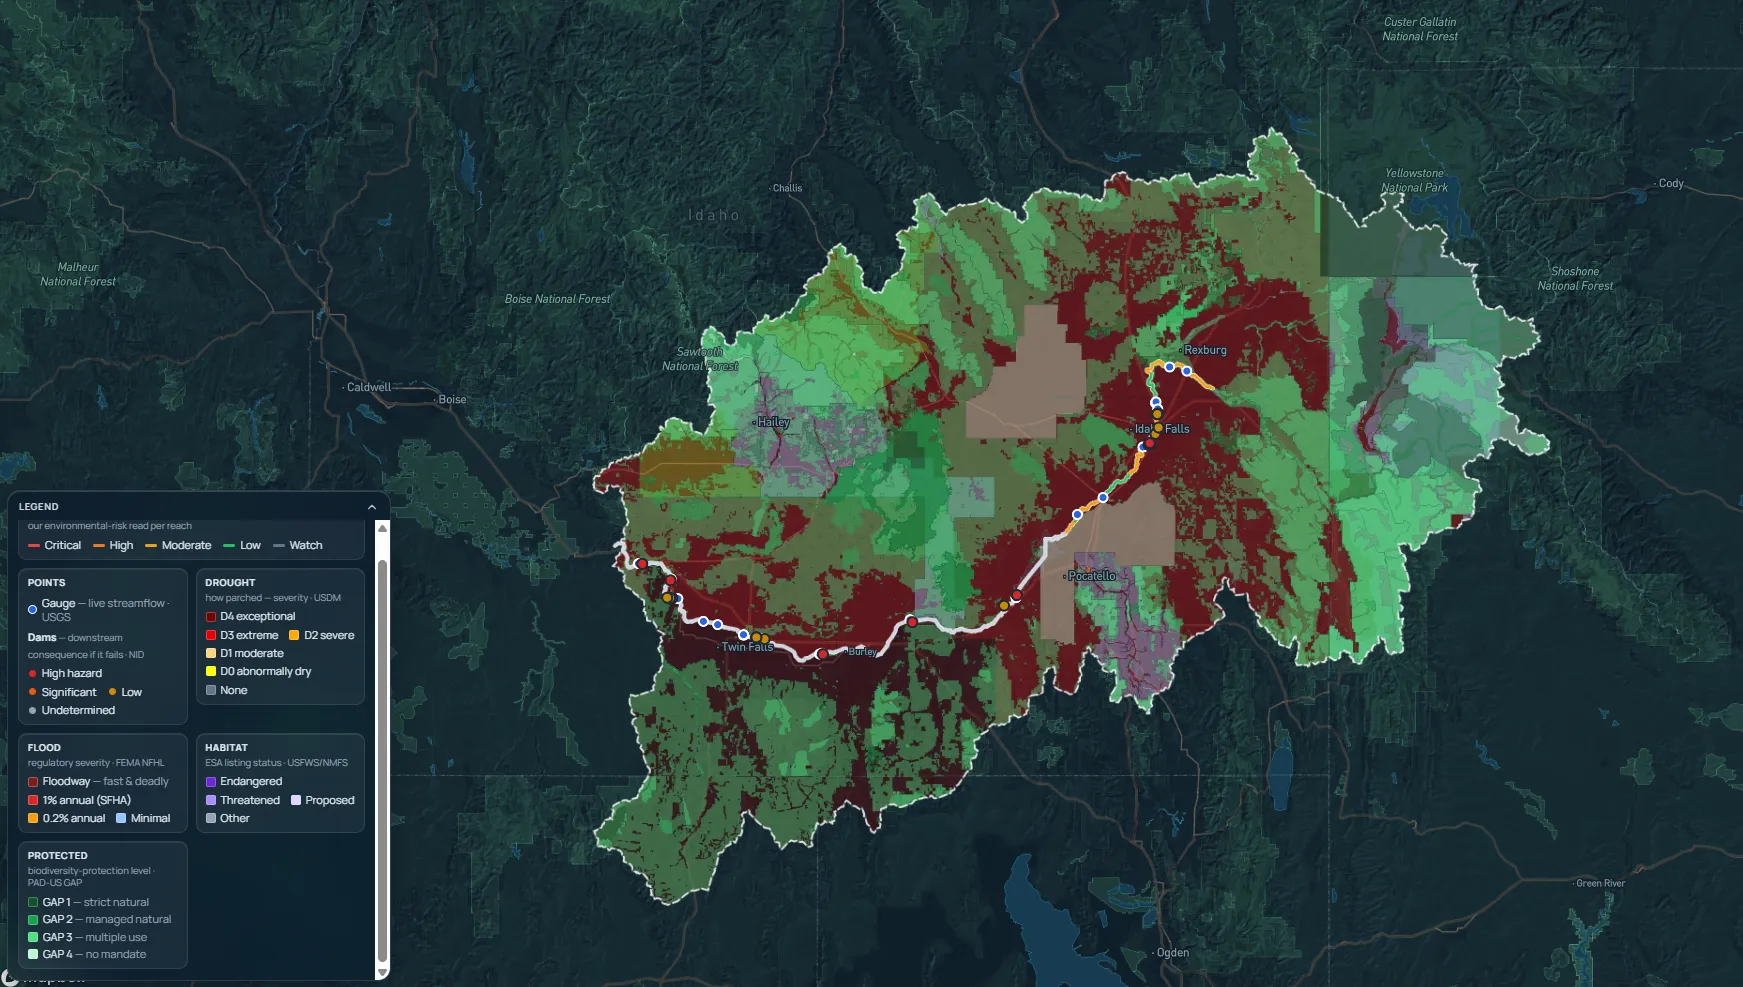
For every reach in your corridor, Driftwise pulls live and modeled readings from more than a dozen federal data sources, scores each one against scientific thresholds, and weights them into a single 0–100 risk score and band. Corridor scores roll up the reaches they run through, carry a 90-day trend, and export to a branded PDF your agency and funders can act on.

The 0–100 score, banded
Critical80–100High60–79Moderate40–59Low20–39Watch0–19

Scored from more than a dozen federal data sources — USGS · NOAA · EPA · FEMA · USFWS · NIFC · USACE

Driftwise Environmental Risk corridor map: every stream reach scored 0–100 and color-coded from Critical to Watch, over gauge, dam, drought, flood, and habitat layers
A live corridor scored end to end — each reach banded Critical → Watch, over the gauge, dam, drought, flood, and habitat layers that drive the score.
PANEL / 01Live + modeled signals

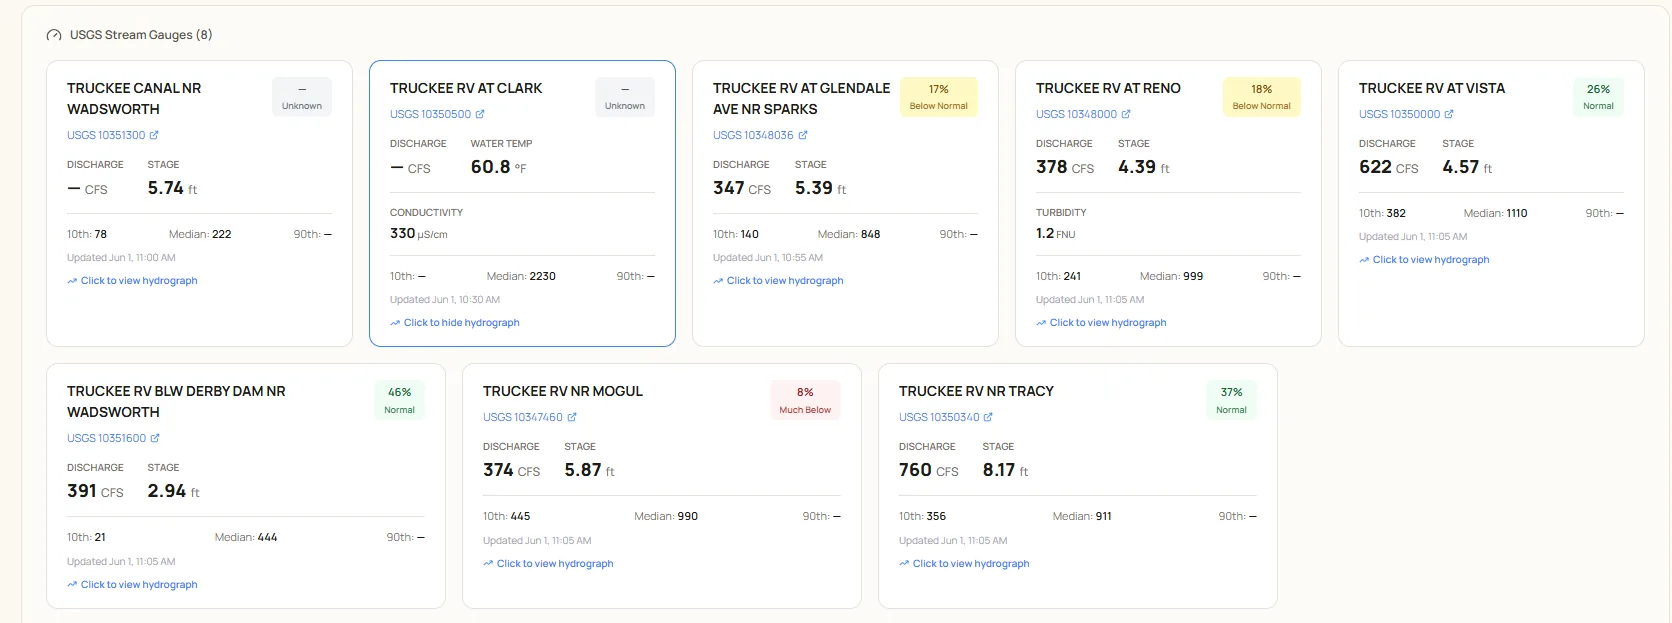
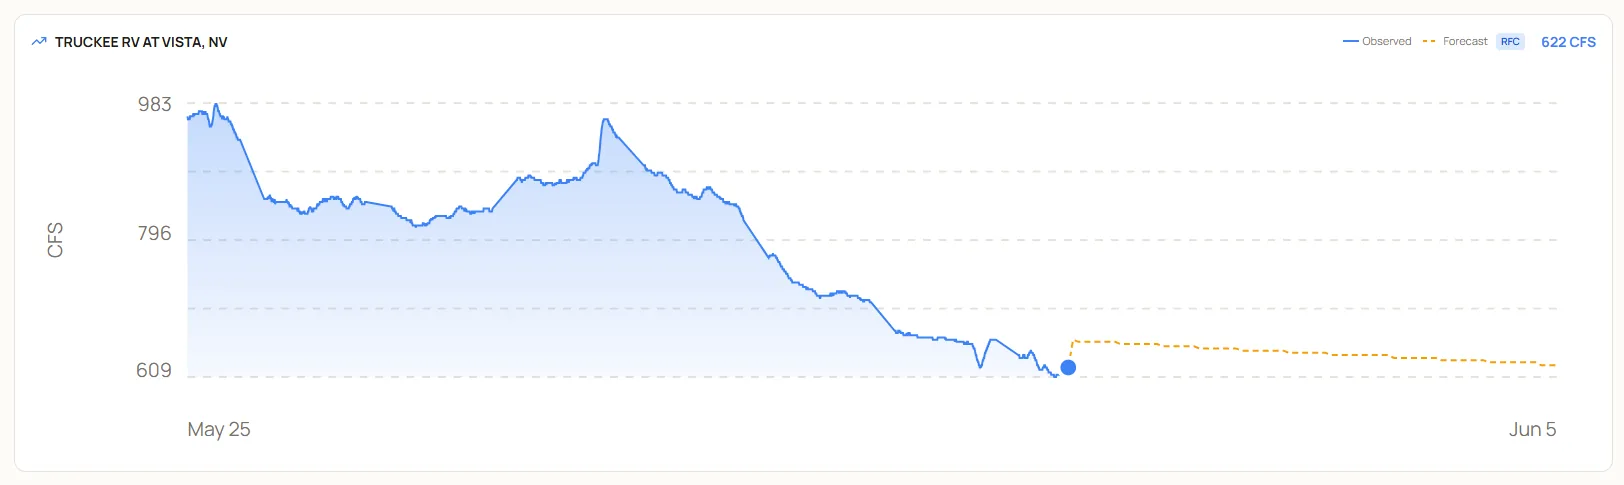
The readings behind the score

Driftwise Environmental Risk · Intelligence panel: The readings behind the score — Live + modeled signalsDriftwise Environmental Risk · Intelligence panel: The readings behind the score — Live + modeled signals
  • USGS gauges — discharge, stage, water temperature, turbidity, and dissolved oxygen — matched to each reach
  • NOAA's National Water Model fills the flow signal wherever no gauge exists, so every reach still scores
  • Every reading carries the time it was observed; stale data lowers confidence in the score instead of breaking it
PANEL / 02Flood · wildfire · drought

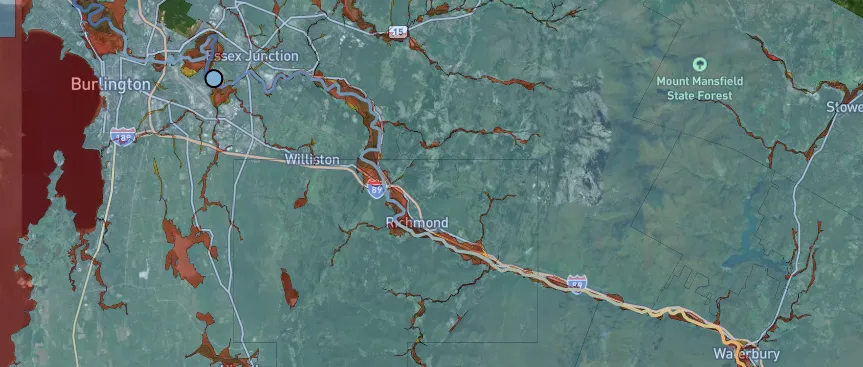
Hazards on the corridor map

Driftwise Environmental Risk · Intelligence panel: Hazards on the corridor map — Flood · wildfire · drought
  • Flood footprints turn raw streamflow into which roads, parcels, and neighborhoods go underwater, and how deep
  • Wildfire perimeters, drought, weather alerts, and impaired-water designations layer onto the same map
  • Boundary and overlays clip to the corridor so the picture stays legible

Every number on this page is traceable back to the field record it came from.

See a corridor risk report
From signal to action

Intelligence that closes the loop.

A risk score only matters if someone acts on it. Driftwise turns a flagged reach into a notified team and a published advisory — without leaving the platform.

  1. STEP 01

    Risk detected

    Every reach is scored 0–100 from live and modeled data. The corridors that need attention rise to the top of the list.

  2. STEP 02

    Team notified

    One click sends an in-app and email alert — with the report PDF attached — to the people who need to act.

  3. STEP 03

    Published & reported

    Publish a public advisory to your map, or export a branded PDF your agency and funders can sign off on.

QUESTIONS WE GET

Straight answers before you book a call.

The things agencies and field biologists usually ask first.

What is Driftwise?

Driftwise is environmental monitoring software. It records field observations and turns them into agency-grade evidence for three kinds of program: mark-recapture fisheries monitoring, habitat restoration and invasive species response, and waterway conditions.

Does Driftwise work for waterway hazard and conditions monitoring?

Yes — it is built for exactly that. Driftwise is the system of record agencies and conservation organizations use to capture waterway hazards and conditions in the field and score them. Crews log hazards offline, and Driftwise combines them with live and modeled readings from more than a dozen federal sources into a 0–100 environmental risk score and band for every river reach, with a public conditions map and one-click PDF for agencies and funders.

How does Driftwise match recaptured fish?

Driftwise uses PIT tag and mark-recapture matching to link a capture to a known individual. A reviewer confirms each match in a QA queue before it enters the population record, so individuals are not double-counted.

How does Driftwise score environmental risk?

For every river reach, Driftwise pulls live and modeled readings from more than a dozen federal data sources, scores each against scientific thresholds, and combines them into a single 0–100 environmental risk score and band, from Critical to Watch. Corridor scores roll up the reaches they pass through, with a 90-day trend and one-click PDF export.

Which data sources does Driftwise use?

Live and modeled readings from federal sources including USGS stream gauges, NOAA's National Water Model and flood forecasts, EPA water-quality and watershed data, FEMA flood zones, U.S. Fish & Wildlife and NOAA Fisheries critical habitat, NIFC wildfire, and U.S. Army Corps of Engineers dam data.

Does Driftwise work offline in the field?

Yes. The mobile companion captures photos, GPS, species, and measurements without a signal and syncs automatically when reception returns.

Can multiple partner organizations share one map?

Yes. Invasive species and restoration programs work off one shared map of every infestation, treatment, and re-survey, with privacy and partner controls so each organization sees what it should.

What does Driftwise cost?

Pricing is still in development. Programs typically start with a single pilot season and expand from there. Contact us to scope a pilot.

SEE IT IN ACTION

One platform for three monitoring programs.

Run a mark-recapture program, coordinate a multi-partner invasive species response, or run the waterway program for a State Park or conservation nonprofit. Driftwise is the software those organizations run on — field observations in, the evidence your agency and funders accept out. We'll demo it against your own program, not a sample dataset.

Request a demo

Free 30-minute demo · No commitment · Bring your own data

GET STARTED

Ready to turn field data into evidence?

Tell us about your program — a watershed, an infestation, a trail system. We'll walk through how a field record becomes the report your agency and funders sign off on, for an organization like yours.

  • A working call, not a pitch

    We spend the time on your actual program — the data you have now and the report you owe.

  • Guided onboarding

    We import your existing records and configure the setup alongside your team.

  • Start with one season

    Run a single pilot first and expand when it earns the next watershed.

GET IN TOUCH

Talk to the team

Send us your corridor, watershed, or program and we'll set up a working demo against your own data — not a sample dataset. We reply within one business day.

Click to reveal — we obscure the address to cut spam.