Modeled flow percentile
12pct
Adds to Severity → signal 62
Where today's modeled flow sits against this reach's own record for this week — low or high both raise it.




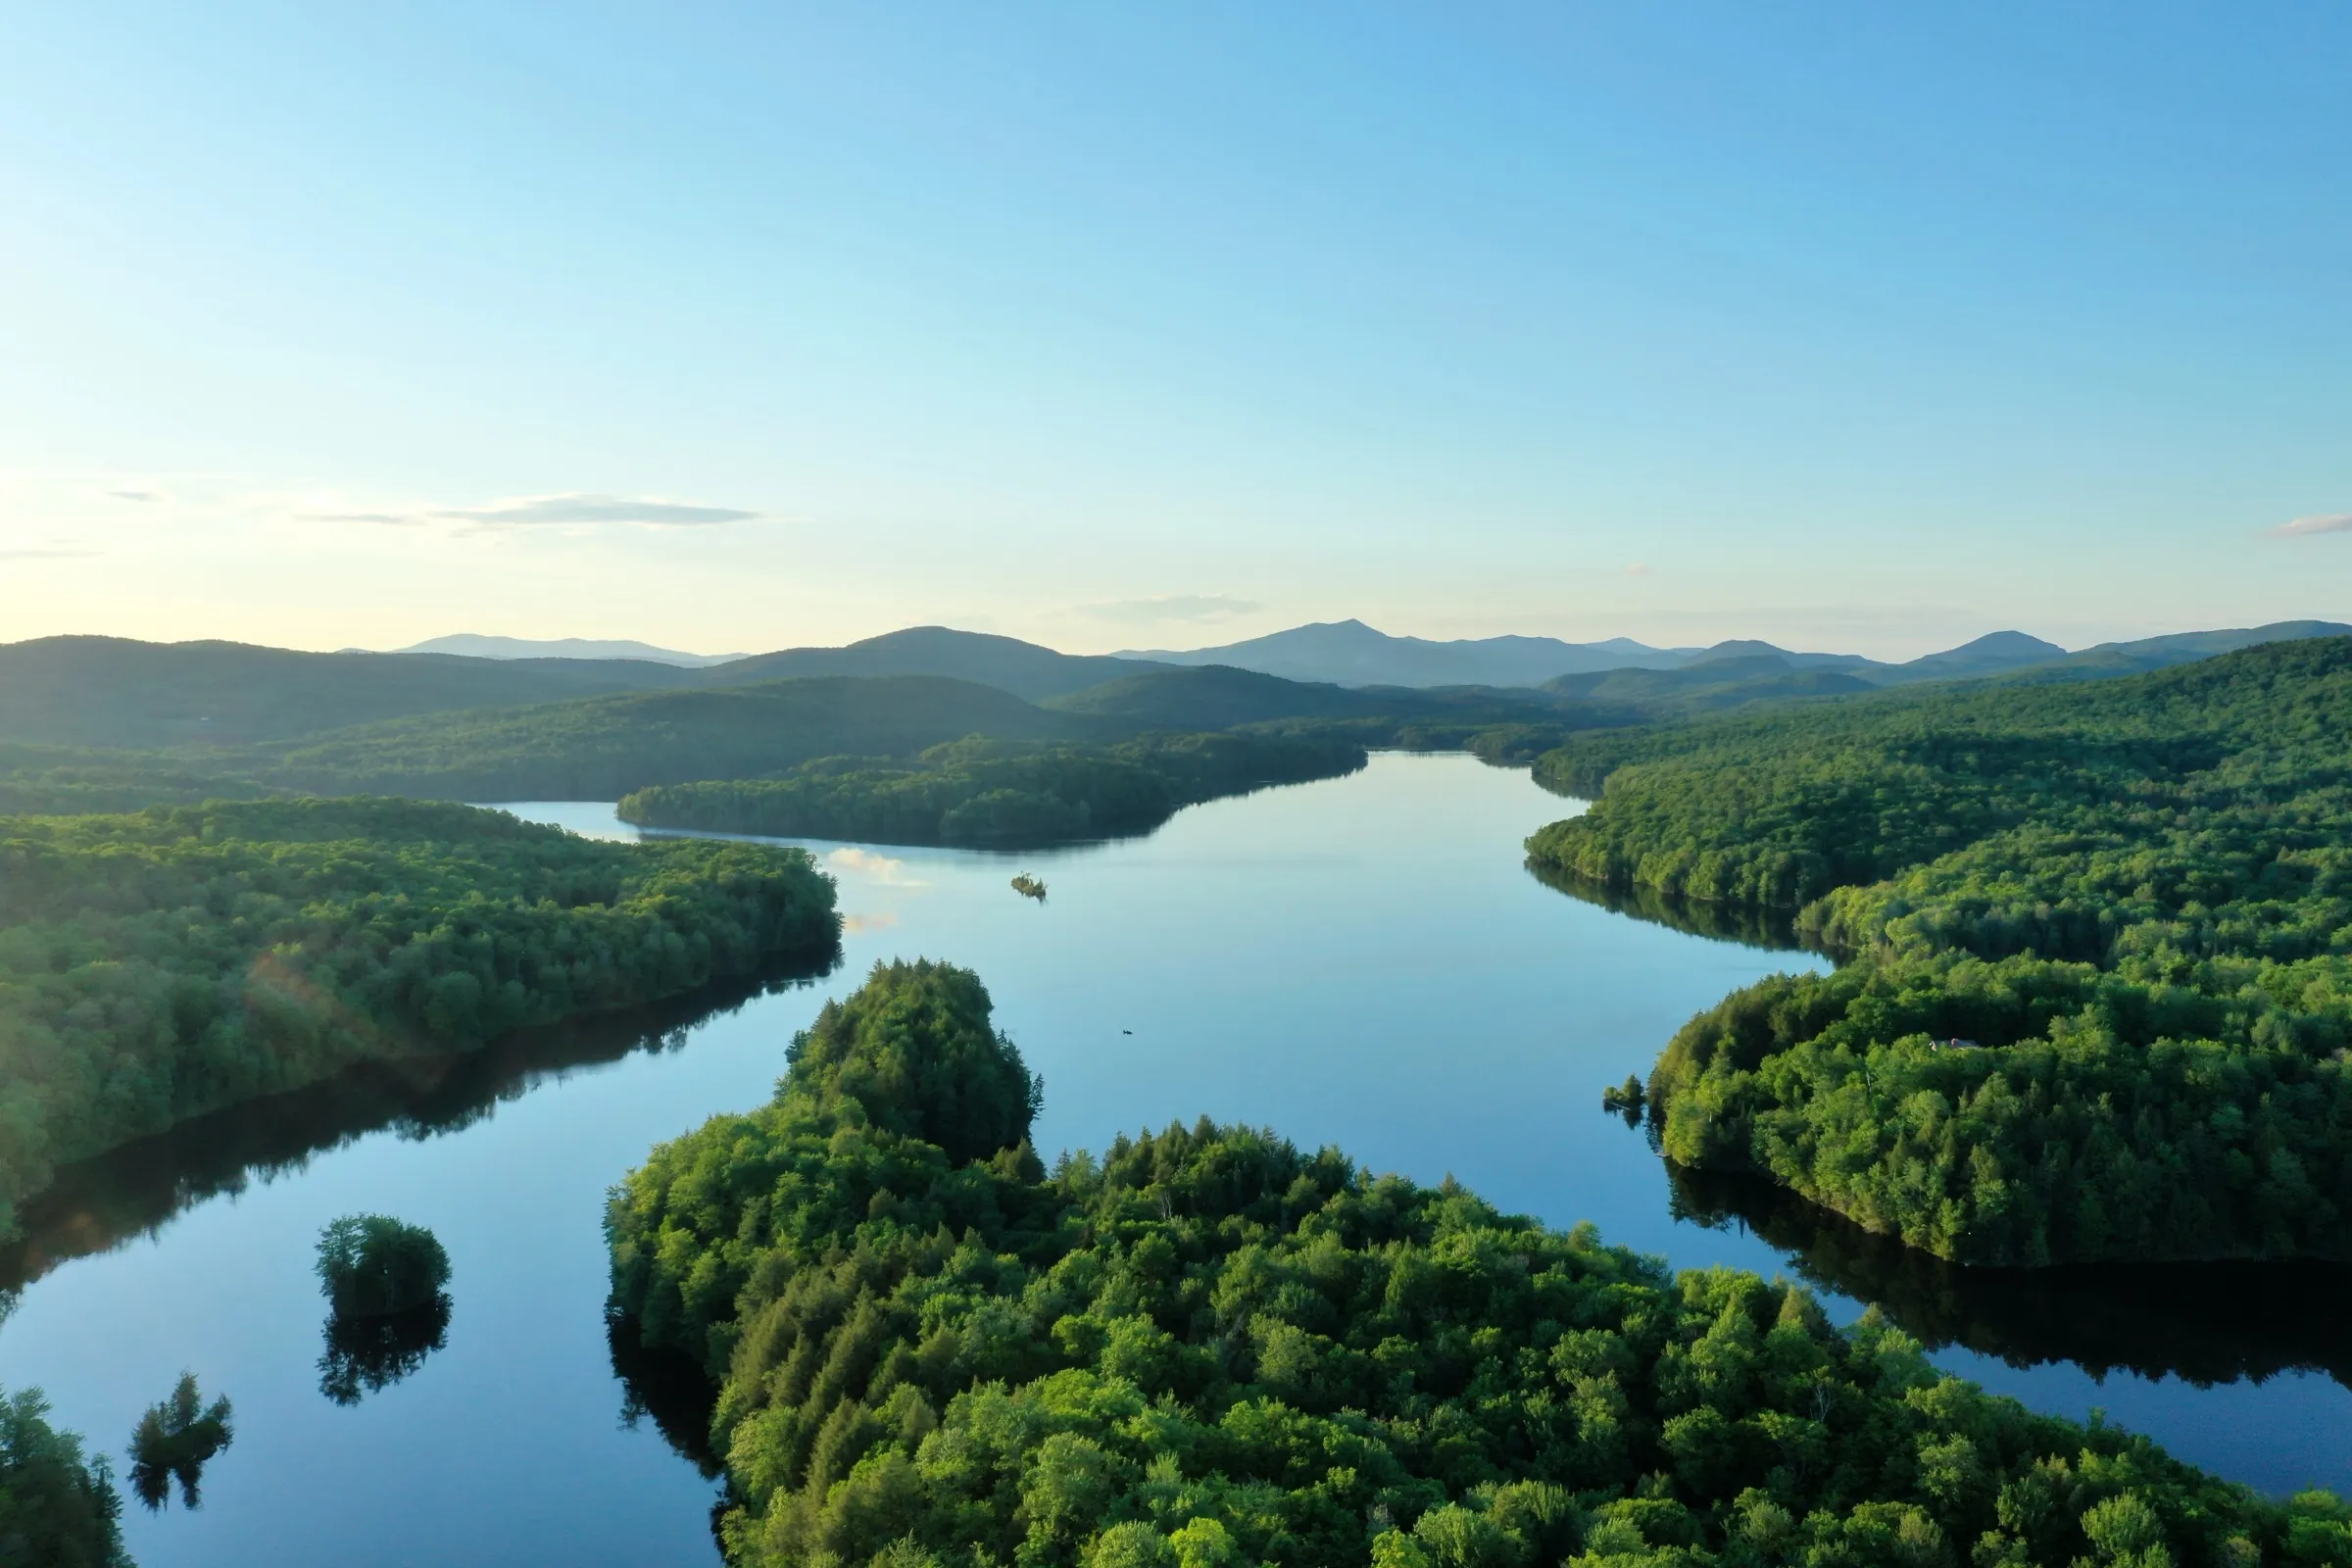
Corridors, closures, hazards, and crews in one place — with a public map that updates the moment staff approves, and a clear read on every reach in the corridor.
Two minutes: the corridor drawn as the record, hazards coming in structured, every change reviewed before it goes public, the live map where paddlers plan, a work plan that reopens the reach, volunteers testing the water — and a clear read on every reach.
When a tree comes down or the river spikes, paddlers find out from your map before they put in. One report's chain of custody, below — strainer to published closure, 07:42 → 08:05.
The trail is defined once, properly — segments, access points, portages, and amenities, drawn snap-to-river along USGS NHD flowlines. Every attribute change is versioned, so when a closure lands there is no argument about where the river actually runs.
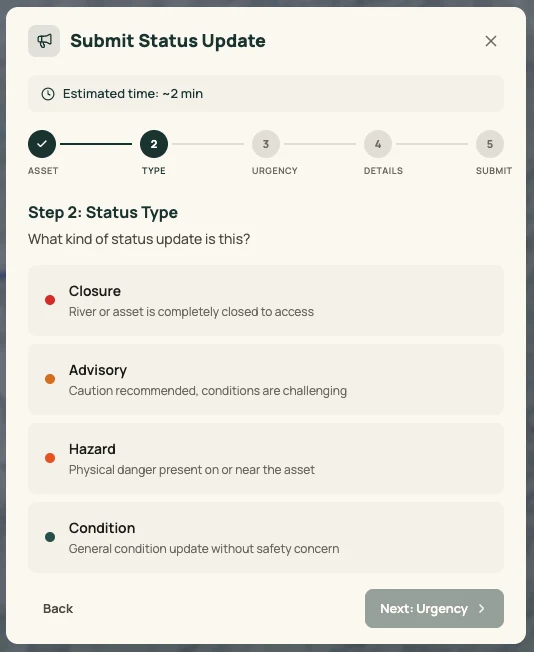
A paddler reports a downed tree across the main channel. It does not land in an inbox — it lands in the model: a type, an urgency, a photo, and a location snapped to the reach it affects. Public hazard reports flow into the same moderated review queue.
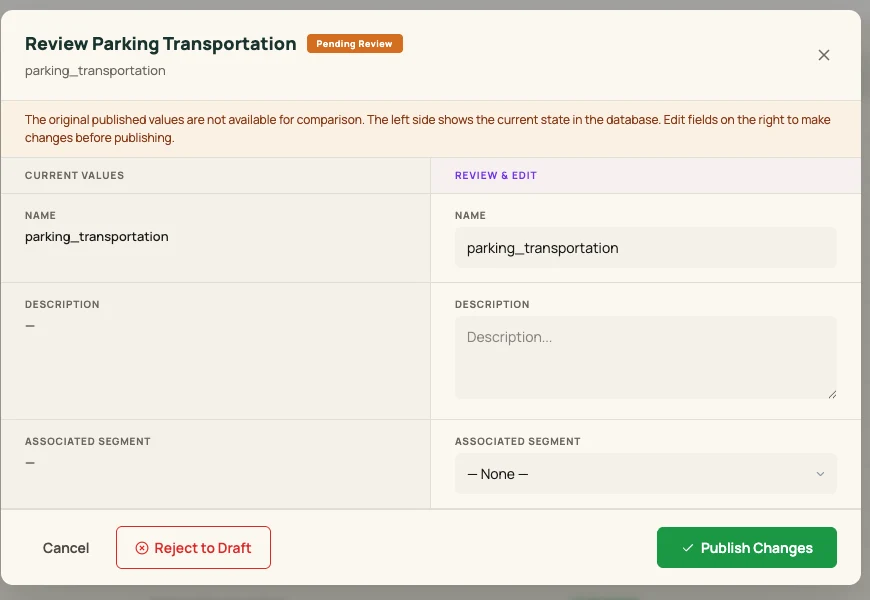
The report waits in a moderated queue, current values beside the proposed change. Conflict detection flags anything that contradicts what is already published; a reviewer publishes it or rejects it to draft, and the audit log records who decided what, and when.
The moment staff approves, the public map updates — branded as yours, white-label down to the basemap, at a shareable URL you can put on a website, a newsletter, or a sign. Twenty-three minutes after the report, the closure is where paddlers plan.
The same published record serves every place a trip gets planned: a Live Conditions widget for your site refreshed every five minutes, an embeddable map that is one script tag with API keys locked to your domains, and printable QR signage at the put-in that opens the map in the app. Visitor analytics show where next season's programming should go.
A conclusion is only worth acting on if you can take it apart. Driftwise watches every reach against live and modeled federal data — then tells you which edge was crossed, what the reading was, and where it came from.
See a corridor reportThe engines are siblings, not a stack — none reads another's conclusion. Pick one to see the inputs it watches.
Select an engine to see what it readsDischarge read as a percentile against this reach's own record for this week of the year — two-tailed, so too little water and too much are both flagged. The National Water Model covers every reach, gauged or not.
Adds to Severity → signal 62
Where today's modeled flow sits against this reach's own record for this week — low or high both raise it.
Adds to Severity → signal 20
The same read from a live USGS gauge, which takes precedence where one reports.
Adds to Severity → signal 30
How entrenched the extreme is — the share of the last 14 days spent outside the normal band.
Returned data · no risk signal for this reach
Forecast peak over baseline flow — a forward-looking flood-trend signal.
Adds to Urgency → signal 40
US Drought Monitor severity over the reach — amplifies low-flow urgency.
Returned data · no risk signal for this reach
Snow-water equivalent vs normal, where snowmelt drives the hydrograph.
Returned data · no risk signal for this reach
NOAA river-forecast flood category on the reach's forecast gauges.
The reach's measured water quality against the thresholds aquatic life responds to, plus the regulatory and landscape context around it — impairment, floodplain, protected land, and upstream pressure.
Adds to Severity → signal 34
Live gauge temperature against the thresholds aquatic life responds to.
Adds to Severity → signal 12
Live gauge oxygen — low readings stress fish first.
Adds to Severity → signal 30
Share of the subwatershed on the EPA 303(d) impaired list.
Adds to Sensitivity → signal 60
Protected land — GAP status 2 is strict biodiversity protection over the surrounding area.
Adds to Exposure → signal 50
Open public / protected land along the corridor — recreational exposure.
Adds to Sensitivity → signal 7
Cumulative flow alteration across the upstream watershed, not the danger of any one dam.
Adds to Sensitivity → signal 3
Share of the upstream watershed under pavement — higher means flashier, dirtier runoff.
Adds to Exposure → signal 70
The regulatory 100-year floodplain — built environment at risk.
Adds to Exposure → signal 80
Downstream consequence if a nearby dam fails (USACE NID).
Each input is watched against its own healthy range. When a reading leaves that range it trips an edge, and the reach takes the state of the worst edge that tripped — never an average, so a lethal reading can never be diluted by a dozen benign ones. Every reach lands here, and arrives with the readings that put it there:
An edge was crossedA reading past its freshness window still resolves — it is marked and weighed down through confidence, so age lowers certainty instead of vanishing.
Every card carries its provenance. You can see whether a number was read off a gauge or produced by a model.
Streamflow, flood forecasts, drought and wildfire smoke all shape whether a corridor is runnable. Each is published as a free public map — no login, no paywall.
Click any point in the country — or search a subbasin, gauge or lake by name — and read what nine federal datasets say about it: flow, drought, fire, smoke, flood forecast, satellite cyanobacteria screening, land cover, critical habitat and Clean Water Act impairment, each one labelled with what it is actually a fact about.
Official NIFC fire perimeters and incident points under NOAA’s HRRR-Smoke near-surface forecast, filterable by size, state, and containment.
Every reporting USGS stream gauge in the country, coloured by how today’s flow ranks against that gauge’s own record for this calendar day.
The U.S. Drought Monitor — the country’s official weekly drought assessment — drawn across five severity categories from D0 to D4.
NOAA’s river forecast centres call the next few days at every forecast gauge in the country, on the National Weather Service’s own flood categories — action, minor, moderate and major.
Every subwatershed in the country against the states’ own Clean Water Act assessments — what is impaired, what is still on the 303(d) list, what is causing it, and how much of the country nobody has assessed at all.
NASA and EPA’s satellites read a pigment index over roughly 2,300 U.S. lakes large enough to resolve at 300 m. A pre-screening indicator, not a health assessment, and never a substitute for your state’s advisory.
Every river and stream the federal government has designated as ESA critical habitat, the listed species each unit is designated for, and who manages the protected land around it.
Coordinate a multi-partner invasive species response, or manage the waterway program for a state park or conservation nonprofit. Bring your own program to the demo and we'll run Driftwise on it, live.
Request a demoA free 30-minute working session with your data on screen.
Tell us about your program — a watershed, an infestation, a trail system. We'll walk through how a field record becomes the report your agency and funders sign off on.
A working call, not a pitch
We spend the time on your actual program — the data you have now and the report you owe.
Guided onboarding
We import your existing records and configure the setup alongside your team. Role-based in-product tours carry the rest of the crew after the call.
Start with one season
Run a single pilot first and expand when it earns the next watershed.
Send us your corridor, watershed, or program and we'll build the working demo around your records. We reply within one business day.
Click to reveal — we obscure the address to cut spam.